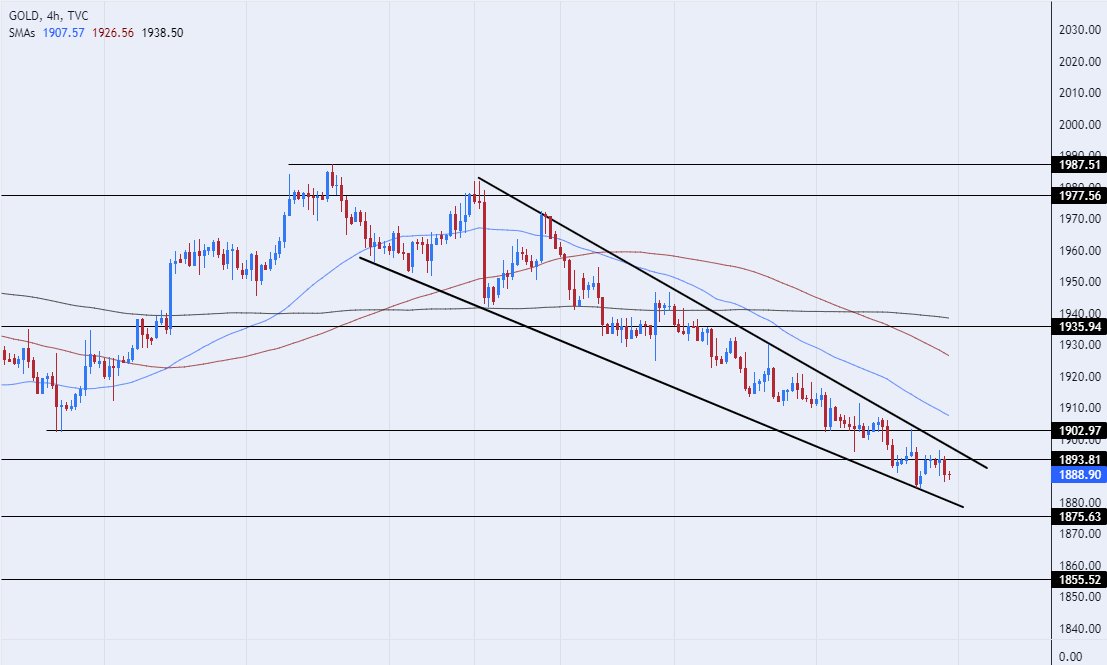
Recommendation for gold for the week against the dollar
- The risk is 0.35%.
- A buy trade was triggered last week, and my stop loss suffered
Our recommended forex brokers in the region
Best buy entry points
- Enters pending buy order from 1840 levels.
- Best pips points to close stop loss below 1810 levels.
- Move the stop loss to the entry area and take profit when the price rises to $12.
- Close half of the contracts with a profit equal to $15 and leave the remaining contracts up to strong resistance levels in 1980.
Best selling entry points
- Entering sell order pending order from 1900 levels.
- Best pips points to place a stop loss closing the 1920 high.
- Move the stop loss to the entry area and take profit when the price rises to $12.
- Close half of the contracts with profit equal to 15 pips and leave the remaining contracts up to support levels 1840.
Prices fell Gold During last week’s full trading week, pessimistic expectations about monetary policy rose after the release of the minutes of last July’s Federal Reserve meeting, which was characterized by tightening, as most monetary policymakers said “uncertainty”, which requires additional tightening. During the monetary policy committee meeting last July, officials expressed the persistence of inflation risks, which they described as still “on the upside”. Keeping in mind that the current inflation rate is far from the central bank’s target of 2 percent adds some additional pressure around the need for a flexible labor market.
Although Monetary policymakers said current indicators show a kind of gradual slowdown around economic activity. At the same meeting, some officials “expressed concern about the overall effects on the economy as a result of the tightening of monetary policy in recent months. Some sectors, such as the banking sector, are negative.” During the meeting, all members voted to raise the target range for interest rates, amid warnings that this would “lead to a sharper-than-expected slowdown in the economy”.
Gold reacted negatively to the central bank’s minutes, as the precious metal fell to its lowest level in five months, amid expectations of continued monetary tightening.
On the technical side, Gold prices ended in the red during last week’s trade. Gold traded in a falling wedge pattern over the 240-minute time frame shown on the chart. If the price of gold falls, it can target the strong support levels accumulated at 1875 and 1855 respectively. On the other hand, if the price rises, it can target the resistance levels accumulated at 1924 and 1944. , respectively. At the same time, the price is trading below the moving averages of 50, 100 and 200 in daily time frame and four hour time frame respectively. medium term. While gold may witness some bullish corrections, we expect gold to continue to decline until it settles into a falling wedge pattern. Please maintain capital management and engage in buying and selling transactions as per the daily development of gold news that we announce on a daily basis.
Map created on the platform Trade show
Follow the gold forecast next week connection

“Award-winning beer geek. Extreme coffeeaholic. Introvert. Avid travel specialist. Hipster-friendly communicator.”

